Elevate Your Brand with 3D Innovation

Experience cutting-edge digital marketing in a luxurious, interactive environment tailored for your success.

Rated 5 Stars by Clients

★★★★★

Elevating Digital Marketing Experiences

At ebuzz ninza, we craft luxurious, high-end 3D interactive websites that redefine digital marketing with elegance and innovation, ensuring your brand stands out in a competitive landscape.

150+

15

Trusted by Leaders

Innovative Solutions

At Ebuzz Ninja, we harness AI-powered strategies to work smarter and drive real growth for our clients. Our innovative digital marketing solutions ensure maximum efficiency, visibility, and success in the ever-evolving digital landscape.
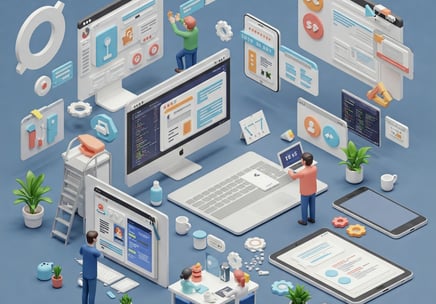
Ebuzz Ninza transformed our online presence with their stunning 3D interactive website. Truly exceptional work!

VIKASH

A person with glasses and a beard is sitting at a white desk, working on a laptop. They are wearing an orange t-shirt with text on it. The surroundings include a brightly colored office space with a predominantly yellow theme. There is a wall with the words 'Digital Agency' and a glass partition featuring playful icons.

The luxurious design and engaging features of our site have impressed every visitor. Highly recommend Ebuzz Ninza!

AMIT

A digital dashboard displays metrics related to web performance. Graphs show detailed statistics such as total clicks, total impressions, average click-through rate (CTR), and average position over time. The chart utilizes various colors to distinguish different data sets, and the interface features tabs labeled 'QUERIES', 'PAGES', 'COUNTRIES', 'DEVICES', and 'SEARCH APPEARANCE'.
★★★★★
★★★★★